Elevate your industrial interoperability: A primer on data Pipelines

Since its inception, the Intelligence Hub could address these problems through Modeling. And if a raw data value needed to be transformed (e.g., deadband, aggregation, custom logic) before it was modeled, this could be addressed with Conditions. But what if target systems impose requirements beyond these capabilities?
What if...
- there are more than typical OT nodes, like SCADA or a historian, in the architecture?
- the target systems include IT applications or cloud services?
- the target systems need more than individual data points to be labeled and organized?
- the interfaces, supporting use cases, and underlying infrastructure require complex payloads and logical, stateful delivery?
- there is variable cost infrastructure involved?
- data must be acquired or transformed in multiple stages in a specific sequence?
Addressing these “what-ifs” is the foundation of Pipelines. Pipelines is complex event stream processing for making industrial data usable.
With the release of HighByte Intelligence Hub version 3.3, Pipelines has been upgraded to better manage complex Industrial DataOps workloads. As new features and functionality are introduced, we want to ensure that users can get most out of Pipelines. With that in mind, here is a primer.
Version 3.0: Foundation and Post Processing
The first iteration of Pipelines, released with version 3.0 in February 2023, focused on what we commonly refer to as “post processing.” After data was modeled, users needed to further curate the payload. They were not necessarily altering the makeup of the modeled payload semantically, but they were tailoring it to the needs of a use case or target system.
Here are some examples:
Optimizing delivery for Cloud Data Lake
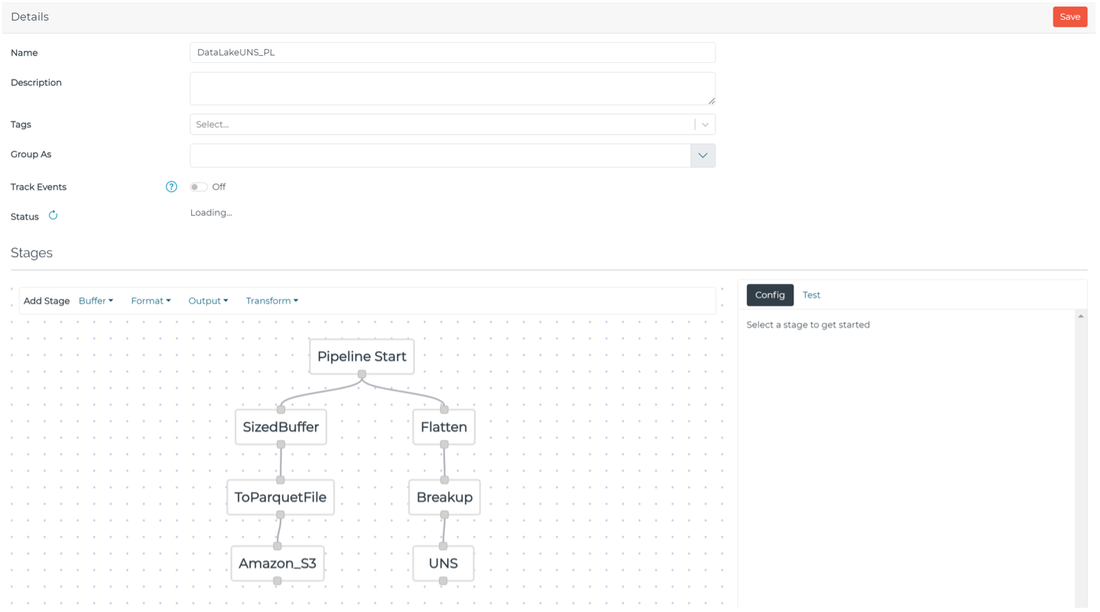
Suppose you needed to analyze high-resolution, large, or historical data sets in the cloud. If the data does not need to be consumed near real time, it would be extremely inefficient to publish on a “per-event” basis to a broker or streaming service for ingestion. Instead, you could publish data in bulk to an object storage service, such as Amazon S3 or Azure Blob Storage. Pipelines can:
- process the modeled data;
- buffer it over a defined size or time interval;
- format it as an Apache Parquet file;
- publish it to the object storage service.
This gets data into the cloud efficiently and ready-to-use without additional processing.
Optimizing delivery for UNS and SCADA / IIoT Platform
Suppose you needed to make modeled data sets more accessible for OT teams to visualize in SCADA, HMI, or Andon systems. Visualization solutions tend to make more use of data values than data structures. Burdening teams with parsing and transforming data structures inhibits time-to-value when developing visualizations. Pipelines can
- flatten modeled data sets;
- break them up;
- publish them into individual key-value pairs.
Version 3.1: Post Processing, Refined
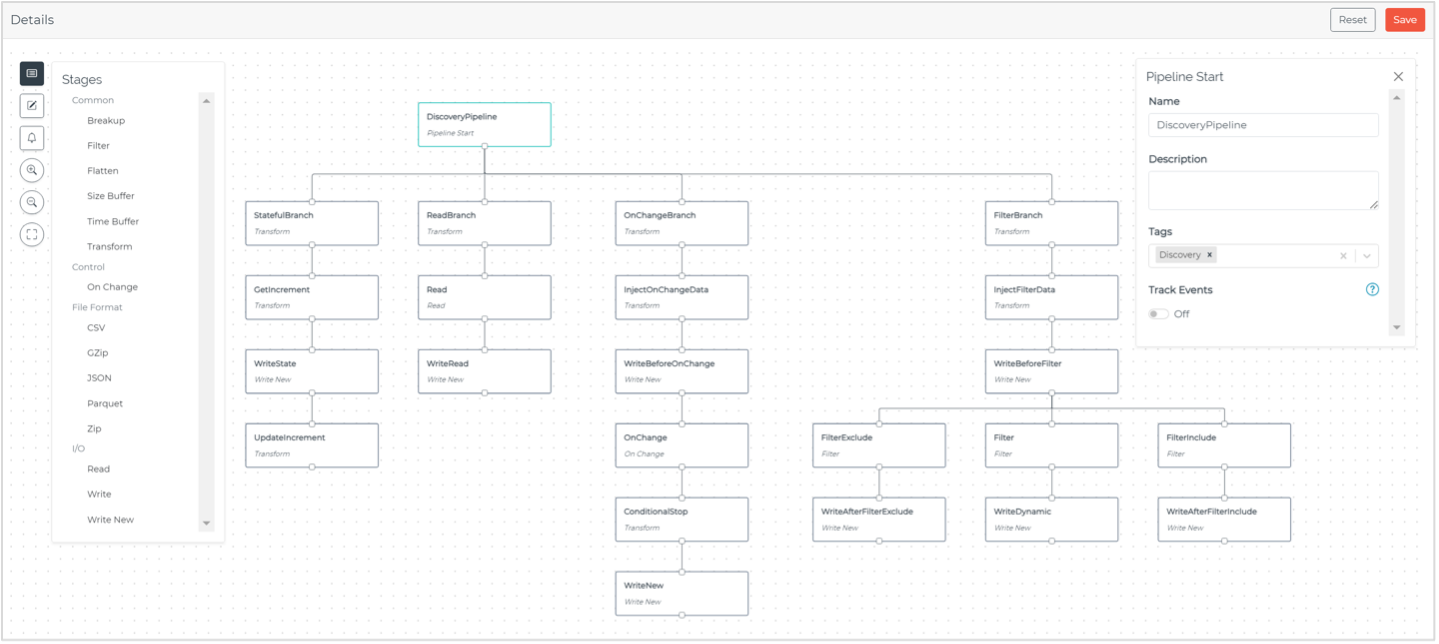
The next iteration of Pipelines, released in version 3.1, added the capability to compose parallel execution paths within a single Pipeline. Using the previous cloud data lake and visualization use cases for example, both could be accomplished within a single Pipeline.
But many Intelligence Hub users had use cases involving multiple target systems with unique payload requirements that shared the same semantic model. For example, an operations team may need to monitor the current state of a production process within an on-premises application while a business intelligence team may need to analyze its history to discover new insights in the cloud. Pipelines makes this possible without any duplicative engineering effort. By building upon engineering efforts iteratively in the Intelligence Hub, data engineers can be agile as requirements evolve.
In addition to the parallel execution paths, version 3.1 introduced the capability to monitor the pipeline state by subscribing to the $SYS topic namespace within the Intelligence Hub’s embedded MQTT broker.
Version 3.2: Data Engineering
With the release of version 3.2, Pipelines rapidly evolved from a set of “post processing” capabilities to a core part of the Intelligence Hub for data engineering. Pipelines began to prove itself as invaluable at solving the most challenging interoperability problems.
Here are a few examples:
Filter Stage
The Filter stage enabled granular inclusion or exclusion of attributes within a payload and the ability to retain this data as metadata for driving the pipeline. For example, the Filter stage can be used to dynamically route data to a UNS topic or database table and discard the routing information from the payload.
On Change Stage
The On Change stage simplified the delivery of complex payloads on a “report-by-exception” basis. It also helped make timeseries-oriented datasets from OT systems much more consumable by IT systems. Line of business users could work with telemetry data in the business intelligence tools with which they are familiar. This stage made OT data “look” like the relational data typically found in IT.
Compression Stage
The Compression stage provided users options to apply Gzip/Zip compression to their payloads before delivery. This was must-have functionality for moving large data sets or backfilling historical data. Larger datasets, especially those containing buffered events, tend to contain repetition and lend themselves well to compression. Users that paired this stage with cloud services with native support for compression data observed significant improvements in the volume, speed, and processing of their industrial data. This made challenging analysis and ML use cases involving OT data that was previously stranded in MES and historians possible.
The real step change in Pipelines came with the Read stage, State Variables, and User Experience (UX) overhaul. Before the addition of these stages, Pipelines was essentially transforming data sequentially. But now, Pipelines can sequentially acquire and transform data—and do so statefully. This opened a new realm of possibilities of what users could do with their industrial data at scale.
Read Stage
The Read stage allowed users to directly source data from connection inputs, conditions, or model instances anywhere within a Pipeline. The data could be read directly into a given payload or used to drive the Pipeline’s behavior as metadata, expanding the level of interaction possible between payloads passing through Pipelines and the data existing elsewhere in the architecture.
I think the real power of the Read stage was the ability to manage and tie together connection input dependencies. Transactional systems, such as ERP and MES, expose their data across many APIs with unique identifiers. For a single use case or event, it’s not uncommon to sequentially iterate through many API calls to successfully retrieve or publish data to these systems.
For example, suppose you wanted to display the state, performance, and open work orders for many assembly lines. The state and performance might be coming from OPC UA servers, but the work order data resides in an MES that has an API endpoint to return a list of work orders based on a line identifier. It also has a separate API endpoint to return other information, such as scheduled date and due date based on the work order. In this scenario in which data is scattered across many sources and is not easily related, a Read stage can first retrieve the list of work orders by line, and then another Read stage can use these work order identifiers to retrieve the dates associated with the work orders. In the end, a user would have consistent, contextual payloads containing line state, performance, and work orders for every line in their enterprise.
State Variables
Pipelines became stateful with the introduction of State Variables. Pipelines could now persist data and metadata independent of a Pipeline’s execution, even when the Intelligence Hub is restarted. Pipeline stages could set and get these state variables, allowing the Intelligence Hub to “hold” long running manufacturing events or modes to drive conditional logic.
For example, Pipelines could be used to track asset state (e.g., down, off) and duration or even drive the publishing behavior of a pipeline when an asset is unavailable. Other use cases included stateful ETL. For example, if data were being backfilled from an on-premises historian or database to a cloud service, the pipeline could manage the read index in a State Variable, ensuring reads from the historian or database occur only when there is a successful write to the cloud service. Effectively, this becomes a self-aware integration with no risk of data loss.
UX
Version 3.2 included many usability enhancements to better build and diagnose pipelines, including an improved interface for the graphical Pipeline builder, zoom functions, and panel hiding for efficient Pipeline stage management. A Test Write feature was added troubleshoot and verify writes to target systems. A Usage menu was added to understand and interrogate the configuration dependencies of a Pipeline.
Version 3.3: Pipeline Observability
In HighByte Intelligence Hub version 3.3, announced earlier this year, we unveiled a significant usability upgrade to Pipelines: Pipeline Observability. Pipeline Observability integrates activity tracking directly into the graphical pipeline builder, allowing users to easily view and monitor the status of Pipelines as they build them. From a single location, users can manage configuration as well as understand performance and errors of their Pipelines.
Pipeline Observability builds three usability features directly into the graphical pipeline builder: Status, Statistics, and Replay.
Status
Observe pipeline state and catch any errors in real time throughout all pipeline stages.
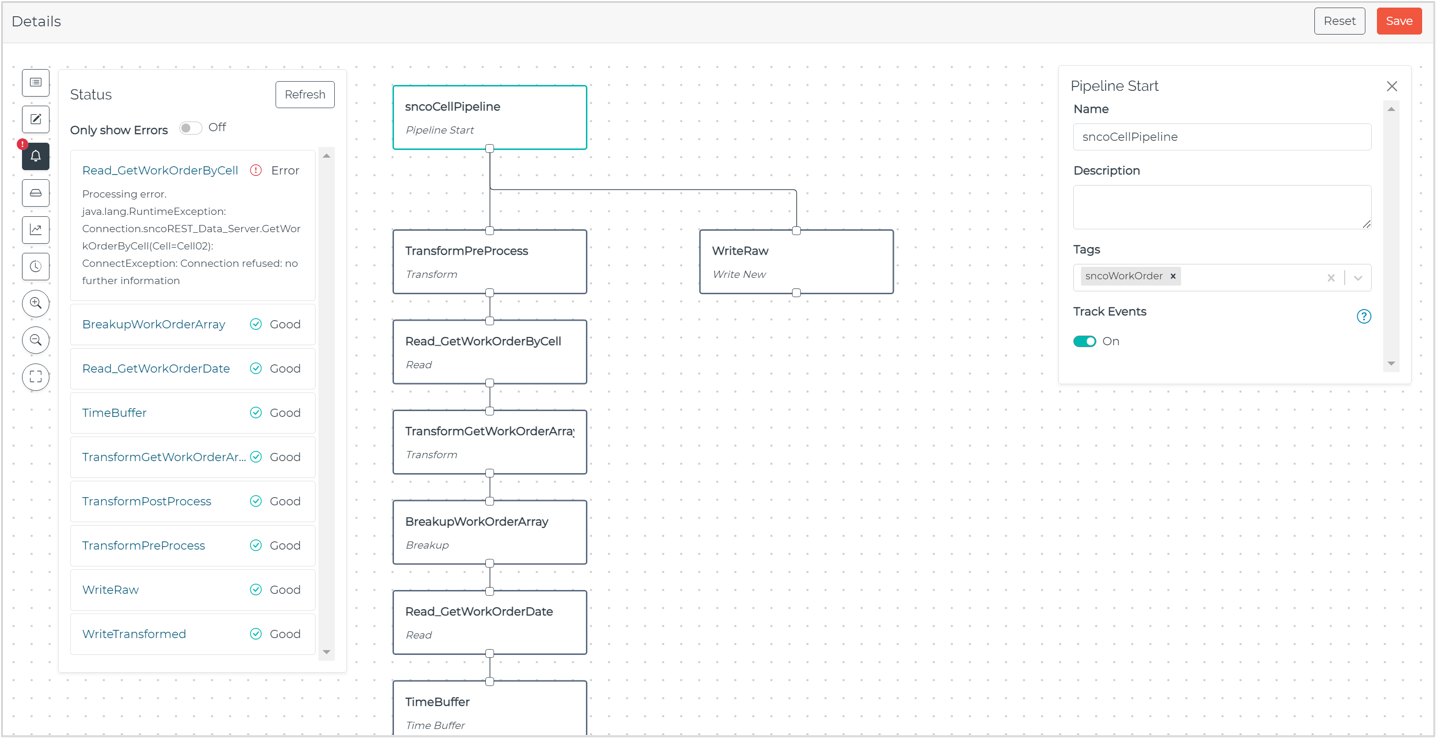
Figure 4: Observing pipeline state with the Status feature in HighByte Intelligence Hub version 3.3.
Statistics
Monitor pipeline performance with high-level metrics tabulating completions, queues, errors, and more. Study the configuration while monitoring its performance. Refine configuration by optimizing execution, waiting time, and stage metrics.
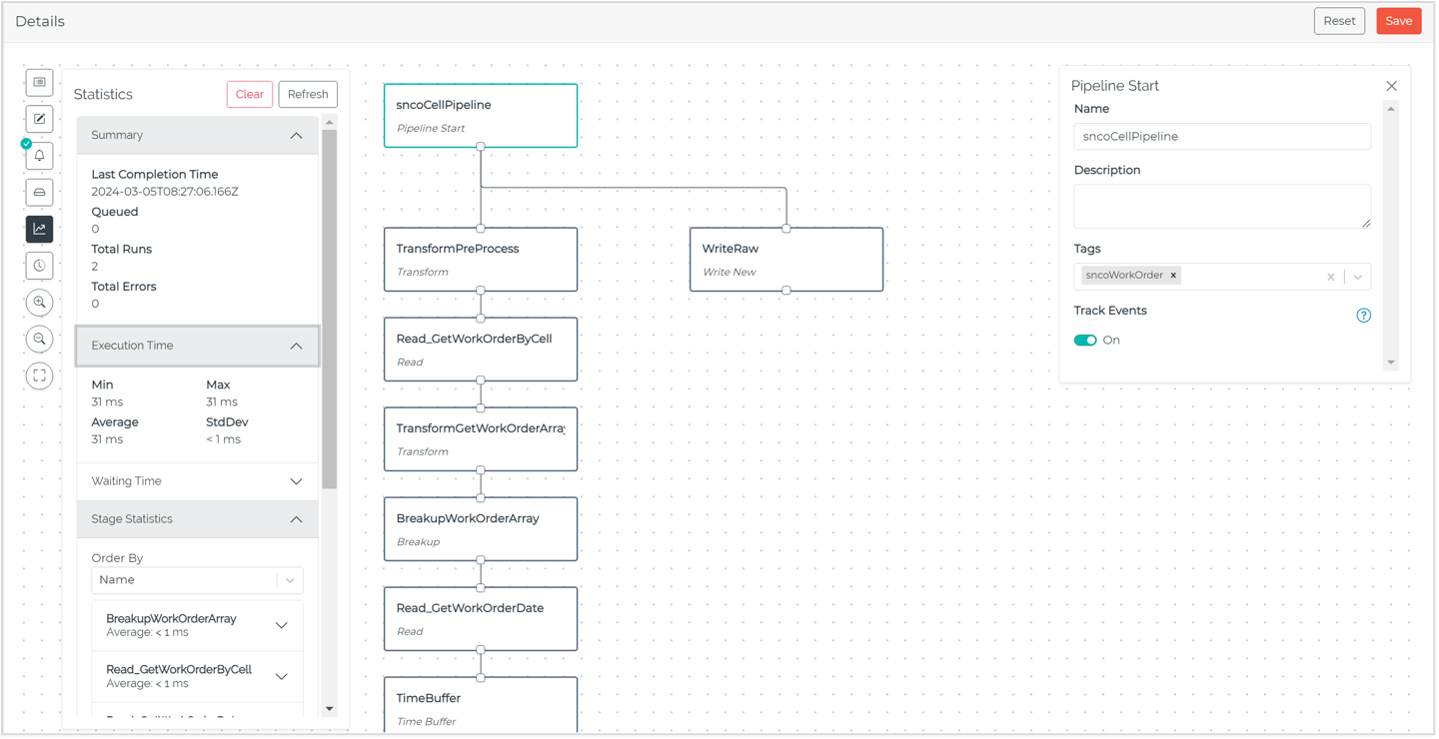
Figure 5: Monitoring key performance metrics with the Statistics feature in HighByte Intelligence Hub version 3.3.
Replay
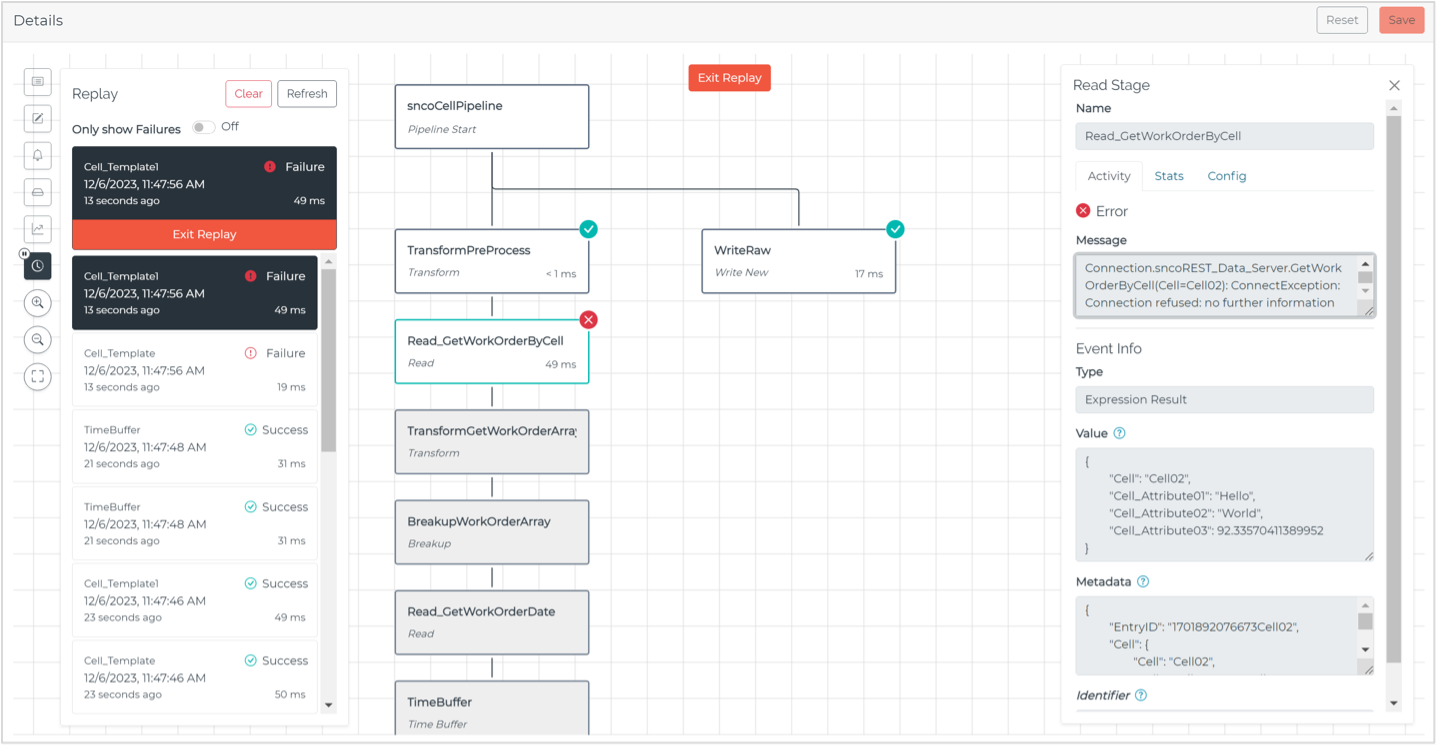
Playback pipeline history with Pipeline Replay. Track executions at an individual event level, including execution time and success/failure. Filter out failed events to pinpoint and discover the root cause of pipeline issues. Easily investigate stage errors and performance bottlenecks.
Wrap Up
In future releases, we will continue to invest in data Pipelines to provide our customers with the data engineering capabilities they need to enable increasingly sophisticated use cases at the edge.
Get started today!
Download the software to get hands-on access to all the features and functionality within HighByte Intelligence Hub and start testing in your unique environment.

